Uncategorized files
From GARDGuide
Showing below up to 50 results in range #151 to #200.
View (previous 50 | next 50) (20 | 50 | 100 | 250 | 500)
 MtMilliganMineMap.gif 587 × 448; 76 KB
 NAGpHvsNAPPforsevenwasterocklithologies.gif 719 × 415; 22 KB
 NNPversusNPRfor ProposedCu-AuMine.gif 572 × 380; 7 KB
 Newcrestlogosm.gif 149 × 62; 2 KB
 Newmont.jpg 168 × 66; 9 KB
 NoticeboardinaminingcommunityinGhana.jpg 450 × 357; 43 KB
 ObservationsandLoggingofCoreforARDAnalysis.gif 700 × 778; 79 KB
 OpenPitBenchPlanDevelopedDuringtheFeasibility.gif 600 × 698; 109 KB
 OptionsandEffectivenesswithTime.gif 552 × 393; 41 KB
 OverallGARDFlowChart.gif 714 × 812; 53 KB
 OverallGARDFlowChart.jpg 714 × 812; 217 KB
 OverallSegregationofVariousWasteRockUnits.gif 600 × 601; 101 KB
 Overallhierarchyofminewatermanagement.gif 580 × 360; 9 KB
 PeriodicTableForPassiveTreatment.gif 631 × 442; 35 KB
 Photographandacross-sectiondiagramofaRAPSinstallation.jpg 705 × 237; 47 KB
 Photoofwetlandinwhichbacterialsulphidegeneration.jpg 370 × 516; 68 KB
 PlotofABAResultsandARDCriteria.gif 475 × 523; 26 KB
 PlotofABAvsNAGResults.gif 630 × 443; 13 KB
 PlotofMetalLoadingsvsSulphate.gif 560 × 380; 19 KB
 PotentialPositionforaDrainageTreatmentFacility.jpg 1,000 × 380; 91 KB
 PreventionandMitigationEvaluationofAlternatives.gif 600 × 589; 37 KB
 Pulsedlimestonebedtreatmentsystem.gif 770 × 301; 23 KB
 ReducingandAlkalinityProducingSystem.gif 679 × 209; 19 KB
 RelationshipBetweenFlowRateAndTreatment.gif 544 × 374; 8 KB
 RelationshipBetweenGlobalNationalLocal.gif 428 × 604; 12 KB
 RioTinto.jpg 85 × 77; 7 KB
 RomanPortalwithAcidRockDrainage.jpg 308 × 413; 49 KB
 SampleConfigurationsofSyntheticsinSoilCovers.gif 600 × 622; 28 KB
 SampleSoilCoversDesigns.jpg 650 × 438; 60 KB
 SchematicIllustrationofGeochemicalCharacterizationProgram.gif 750 × 610; 25 KB
 Seepage-Ph-versusTimeIslandCopperMine.gif 680 × 466; 16 KB
 SelectedPassiveTreatmentComponents.gif 762 × 817; 248 KB
 SelectedPassiveTreatmentComponents.jpg 762 × 817; 93 KB
 SelectedPrinciplesthatGovernMineWaterQuality.gif 615 × 344; 38 KB
 SelectionOfPassiveTreatmentTechnologyChart2.gif 868 × 682; 55 KB
 SelectionofPassiveTreatmentTechnologyChart.gif 663 × 983; 75 KB
 SimplifiedEttringitePrecipitationProcessDiagram.gif 713 × 330; 15 KB
 SimplifiedSAVMINProcessDiagram.gif 556 × 403; 45 KB
 Siteswhereactualwaterqualityexactlymatchedpredicted.gif 409 × 368; 41 KB
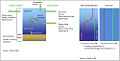 SoluteTransportandThermalStratificationinLakes.jpg 1,000 × 510; 79 KB
 SourceMaterialCharacterizationActivitiesbyMinePhase.gif 800 × 590; 89 KB
 SourceMaterialCharacterizationActivitiesbyMinePhase fr.gif 863 × 1,025; 66 KB
 SourcesPathwaysandReceivingEnvironment.gif 800 × 206; 16 KB
 SourcesandPathwaysofARDNMDandSDinUnderground.jpg 800 × 553; 87 KB
 SourcesandPathwaysofARDNMDandSDinaPit.jpg 800 × 534; 91 KB
 Splash logos.jpg 580 × 132; 14 KB
 SpringThawStreamConcentrationandLoadingTrends.jpg 967 × 548; 112 KB
 StagesintheFormationofARD.gif 750 × 474; 24 KB
 StagesintheFormationofARD fr.gif 744 × 469; 32 KB
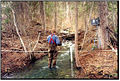 StreamDischargeMonitoringUsingaCurrentMeter.jpg 569 × 385; 90 KB


