Uncategorized files
From GARDGuide
Showing below up to 50 results in range #51 to #100.
View (previous 50 | next 50) (20 | 50 | 100 | 250 | 500)
 Button strike.png 23 × 22; 1,010 bytes
 Button upper letter.png 23 × 22; 311 bytes
 Chapter10LayoutRoadMap.gif 573 × 562; 17 KB
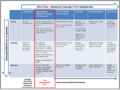 CharacterizationActivitiesbyMinePhase.gif 800 × 599; 65 KB
 CharacterizationActivitiesbyMinePhase fr.gif 737 × 1,001; 48 KB
 CharacterizationChapterRoadMap.gif 566 × 689; 32 KB
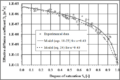 CoefficientofDiffusionversusDegreeofSaturation.gif 700 × 466; 23 KB
 Commercial15horse-poweraerationdevice.jpg 624 × 420; 132 KB
 ComparativeCostsforBarrierCover.gif 543 × 203; 5 KB
 ComponentsofSiteCharacterizationProgram.jpg 800 × 586; 111 KB
 ComponentsofaFieldPerformanceMonitoringSystem.gif 596 × 445; 20 KB
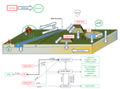
 ConceptSPARROProcessFlowDiagram.gif 800 × 375; 15 KB
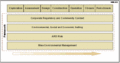 ConceptualARDManagementFramework.gif 613 × 323; 8 KB
 ConceptualARDManagementFramework fr.gif 688 × 363; 18 KB
 ConceptualGYPCIXionExchangeTreatmentProcess.gif 800 × 381; 25 KB
 ConceptualHighRecoveryMembraneDesalinationProcess.gif 730 × 345; 31 KB
 ConceptualModelShowingMetalandAcidSourceRegionsatIronMountain.jpg 700 × 485; 63 KB
 ConceptualRisk-BasedApproach.gif 400 × 399; 13 KB
 Conductivitypeakhasvirtuallydisappeared.jpg 638 × 239; 41 KB
 ConfigurationoftheDenisonTailingsManagemenArea.gif 694 × 539; 47 KB
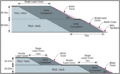
 CoversandClimateTypes.jpg 550 × 407; 50 KB
 CycleforDevelopingandImplementingARDManagementPlans.gif 744 × 525; 17 KB
 DecisionTreefortheDeterminationofAcidGenerationPotential.gif 1,048 × 898; 74 KB
 DecisionTreefortheDeterminationofAcidGenerationPotential.jpg 641 × 558; 54 KB
 DeclineInDrainage-pH-fromOxidationOfAmmonium.gif 585 × 327; 16 KB
 Depletionofnear-surfacetotalsulfurataprospectivecoalminesite.gif 448 × 406; 9 KB
 DevelopmentofaBiologicalMonitoringProgram.gif 465 × 839; 20 KB
 DevelopmentofanARDMonitoringProgram.gif 650 × 892; 65 KB
 DevelopmentofanARDMonitoringProgram fr.gif 726 × 1,019; 65 KB
 DozersReclaiming.jpg 770 × 580; 69 KB
 Drainage Types.jpg 720 × 540; 62 KB
 Drytreatmentsludgestoredagainstthehighwall.jpg 774 × 324; 82 KB
 Earlyattempttoconstructanaerobicwetland.jpg 581 × 420; 104 KB
 EffectofTempOnNormalizedSulphideOxidationRates.gif 750 × 468; 20 KB
 Elementalcompositionofmineralizedrocks.gif 563 × 601; 25 KB
 Estimatedannualaciditygeneration.gif 670 × 146; 8 KB
 ExampleABATable.gif 800 × 476; 45 KB
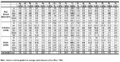 ExampleChemistryTable.gif 800 × 414; 83 KB
 ExampleConceptualSiteModelSchematic.jpg 907 × 673; 109 KB
 ExamplePlotofHCTResults.gif 616 × 352; 18 KB
 ExamplePlotofNPfromTotalCarbonvsNP.gif 568 × 505; 15 KB
 ExampleWasteRockEncapsulationStrategy.gif 567 × 348; 18 KB
 FactorsthatAffectSulphideOxidation.jpg 800 × 449; 68 KB
 Fatuparrow.gif 61 × 123; 346 bytes
 Figure01 Chpt6 - new Fig6-16.jpg 927 × 310; 175 KB
 Figure02 Chpt6 - new Fig6-17.jpg 550 × 410; 117 KB
 Figure4.gif 450 × 445; 9 KB
 Figure5.gif 704 × 646; 16 KB
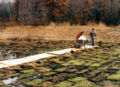
 FishSurveyUsingNets.jpg 418 × 314; 28 KB
 FlowChartfortheDryCoverDesignProcess.gif 640 × 520; 17 KB


