Uncategorized files
From GARDGuide
Showing below up to 100 results in range #51 to #150.
View (previous 100 | next 100) (20 | 50 | 100 | 250 | 500)
 Button strike.png 23 × 22; 1,010 bytes
 Button upper letter.png 23 × 22; 311 bytes
 Chapter10LayoutRoadMap.gif 573 × 562; 17 KB
 CharacterizationActivitiesbyMinePhase.gif 800 × 599; 65 KB
 CharacterizationActivitiesbyMinePhase fr.gif 737 × 1,001; 48 KB
 CharacterizationChapterRoadMap.gif 566 × 689; 32 KB
 CoefficientofDiffusionversusDegreeofSaturation.gif 700 × 466; 23 KB
 Commercial15horse-poweraerationdevice.jpg 624 × 420; 132 KB
 ComparativeCostsforBarrierCover.gif 543 × 203; 5 KB
 ComponentsofSiteCharacterizationProgram.jpg 800 × 586; 111 KB
 ComponentsofaFieldPerformanceMonitoringSystem.gif 596 × 445; 20 KB
 ConceptSPARROProcessFlowDiagram.gif 800 × 375; 15 KB
 ConceptualARDManagementFramework.gif 613 × 323; 8 KB
 ConceptualARDManagementFramework fr.gif 688 × 363; 18 KB
 ConceptualGYPCIXionExchangeTreatmentProcess.gif 800 × 381; 25 KB
 ConceptualHighRecoveryMembraneDesalinationProcess.gif 730 × 345; 31 KB
 ConceptualModelShowingMetalandAcidSourceRegionsatIronMountain.jpg 700 × 485; 63 KB
 ConceptualRisk-BasedApproach.gif 400 × 399; 13 KB
 Conductivitypeakhasvirtuallydisappeared.jpg 638 × 239; 41 KB
 ConfigurationoftheDenisonTailingsManagemenArea.gif 694 × 539; 47 KB
 CoversandClimateTypes.jpg 550 × 407; 50 KB
 CycleforDevelopingandImplementingARDManagementPlans.gif 744 × 525; 17 KB
 DecisionTreefortheDeterminationofAcidGenerationPotential.gif 1,048 × 898; 74 KB
 DecisionTreefortheDeterminationofAcidGenerationPotential.jpg 641 × 558; 54 KB
 DeclineInDrainage-pH-fromOxidationOfAmmonium.gif 585 × 327; 16 KB
 Depletionofnear-surfacetotalsulfurataprospectivecoalminesite.gif 448 × 406; 9 KB
 DevelopmentofaBiologicalMonitoringProgram.gif 465 × 839; 20 KB
 DevelopmentofanARDMonitoringProgram.gif 650 × 892; 65 KB
 DevelopmentofanARDMonitoringProgram fr.gif 726 × 1,019; 65 KB
 DozersReclaiming.jpg 770 × 580; 69 KB
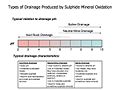 Drainage Types.jpg 720 × 540; 62 KB
 Drytreatmentsludgestoredagainstthehighwall.jpg 774 × 324; 82 KB
 Earlyattempttoconstructanaerobicwetland.jpg 581 × 420; 104 KB
 EffectofTempOnNormalizedSulphideOxidationRates.gif 750 × 468; 20 KB
 Elementalcompositionofmineralizedrocks.gif 563 × 601; 25 KB
 Estimatedannualaciditygeneration.gif 670 × 146; 8 KB
 ExampleABATable.gif 800 × 476; 45 KB
 ExampleChemistryTable.gif 800 × 414; 83 KB
 ExampleConceptualSiteModelSchematic.jpg 907 × 673; 109 KB
 ExamplePlotofHCTResults.gif 616 × 352; 18 KB
 ExamplePlotofNPfromTotalCarbonvsNP.gif 568 × 505; 15 KB
 ExampleWasteRockEncapsulationStrategy.gif 567 × 348; 18 KB
 FactorsthatAffectSulphideOxidation.jpg 800 × 449; 68 KB
 Fatuparrow.gif 61 × 123; 346 bytes
 Figure01 Chpt6 - new Fig6-16.jpg 927 × 310; 175 KB
 Figure02 Chpt6 - new Fig6-17.jpg 550 × 410; 117 KB
 Figure4.gif 450 × 445; 9 KB
 Figure5.gif 704 × 646; 16 KB
 FishSurveyUsingNets.jpg 418 × 314; 28 KB
 FlowChartfortheDryCoverDesignProcess.gif 640 × 520; 17 KB
 FlowchartforMetalandAcidSourceRegionsatIronMountain.jpg 633 × 537; 26 KB
 FlowchartforPerformanceAssessment.gif 500 × 780; 83 KB
 FlowchartforPerformanceAssessment fr.gif 628 × 900; 41 KB
 Framboid.jpg 455 × 423; 24 KB
 FrameworkforARDmanagement.gif 446 × 303; 6 KB
 FreeportMcMoRan.jpg 276 × 48; 5 KB
 FunctionofDissolvedBaseMetalConcentrations.gif 600 × 345; 28 KB
 FunctionofSulphateConcentrations.gif 600 × 348; 21 KB
 GARD Org Chart.png 553 × 507; 80 KB
 GeneralisedModelProcess.gif 584 × 718; 43 KB
 GeneralizedFlowchartfortheARDPredictionApproach.gif 700 × 511; 25 KB
 GenericBiologicalSulphateRemovalProcessConfiguration.gif 800 × 525; 40 KB
 GenericPredictionProgramFlowchart.gif 811 × 1,060; 90 KB
 GenericPredictionProgramFlowchart fr.gif 1,008 × 895; 32 KB
 GenericRangeofDrainageTreatmentTechnologies.gif 800 × 518; 44 KB
 GenericRangeofDrainageTreatmentTechnologies fr.gif 795 × 516; 36 KB
 GeochemicalTestingProgramComponents.gif 800 × 557; 74 KB
 GeochemicalTestingProgramComponents.jpg 615 × 429; 68 KB
 GlobalSulphurCycle.gif 571 × 320; 14 KB
 Gravity-basedcascadingaerationflume.jpg 654 × 567; 88 KB
 GravityStaticmixersbeingusedtoaeratecoalminedrainage.jpg 583 × 382; 31 KB
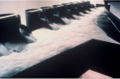
 Groutbeinginjectedintothestreambed.jpg 514 × 359; 71 KB
 GrupoAntofagastaLogo.gif 173 × 60; 2 KB
 HierarchyofManagementTools.gif 400 × 482; 13 KB
 HowanNNPcutoffvalueof12tonsper1000tonscanbeused.gif 537 × 368; 6 KB
 HumidityCells.jpg 520 × 330; 54 KB
 IAP2sPublicParticipationSpectrum.jpg 1,000 × 651; 122 KB
 INAP.jpg 184 × 78; 4 KB
 INCO.jpg 85 × 77; 3 KB
 IllustrationofNormalizedSulphideOxidation.gif 566 × 373; 8 KB
 IllustrationofProcessesAffectingLongTermPerformanceofSoilCovers.gif 670 × 385; 13 KB
 Illustrationofwetlandinwhichbacterialsulphidegeneration.jpg 406 × 237; 20 KB
 InitialDeclineInSeepage-pH.gif 557 × 360; 39 KB
 IntegratedLimestoneLimeNeutralizationProcess.gif 800 × 421; 28 KB
 Julian Beever 1 (Coke bottle).JPG 455 × 300; 23 KB
 Kinross logo.gif 145 × 43; 2 KB
 LimeandSodiumHydroxideConsumption.gif 731 × 283; 19 KB
 Limeslurryandaflocculantbeingadded.jpg 617 × 404; 104 KB
 LocationoftheDenisonMine.gif 674 × 414; 70 KB
 MajorStepsInvolvedinExtraction.gif 610 × 760; 40 KB
 MethodsforPreventionandMitigationofARD.gif 570 × 802; 41 KB
 MethodsforPreventionandMitigationofARD fr.gif 621 × 850; 48 KB
 MineLifeCycleDevelopmentandImplementationofARD.gif 550 × 489; 34 KB
 MinePhaseObjectivesandActivities.gif 601 × 614; 56 KB
 MineralDepositsthatAffectTheirEnvironmentalSignatures.gif 631 × 762; 76 KB
 ModelfortheOxidationofPyrite.gif 491 × 376; 10 KB
 ModelfortheOxidationofPyrite fr.gif 548 × 432; 8 KB
 MolarRatioOfCa+Mg-SO4 .gif 469 × 286; 15 KB
 MonitoringChapterOrganization.jpg 802 × 302; 46 KB
 MtMilliganARDCategory.gif 531 × 552; 96 KB


.JPG)


